Cloud & Local SCADA Solutions
Cloud & Local SCADA Solutions
Inverter Compatibility
Compatible with RS 485/TCP and Sunspec driver inverters, where all drivers can be programmed and tested with less lead time
Meter / Power quality analyzer Integration
Yes
Weather sensors
Yes
Transformer, VCB, Breaker, Network switch Monitoring
Yes
String level Monitoring
Yes
Data Latency to cloud
10 minutes
AI/DI/DO monitoring and control
Yes
No of devices can be connected per Logger
32
Integration to BESS and Other future topologies
Expandable (Additional cost)
Embedded server for Local SCADA with supporting packages
Yes
Support multiple I/O's functionality
Yes
Data security and Cybersecurity compliance
As per Industry standards
Hardware level support-Troubleshooting
In house
Surge protection device incorporated on COMM ports
Yes
Local SCADA with storage and integration to Operator work station (OWS)
Yes
Encrypted connection
Via Secured Mobile VPN
Remote upgrades
Yes
FTP File format transfer
Csv
Remote access
Yes
Site-At-A-Glance
Executive-level dashboard for the customer’s plant portfolio with energy and power of plant from Inverter, Block-wise energy meter and Master control room with device Online/Offline status.
Production Chart
Graph report of power energy ,PR displayed on a hourly, daily and weekly granularity
Device Summary
Energy meter, SMU's ,Weather station, Inverters with Breaker ON/Off status, OTI/WTI status from Transformers
Performance
Display expected energy, actual energy and performance ratio for the portfolio
Production Tools
Portfolio-level view of the power and energy information displayed on a daily, weekly, monthly and yearly granularity
Time Delay
Data Latency to the cloud platform (Every 10 Minutes)
Active Events
Priority of Alarms, notification status and severity level as configured in the event profile
Plant Summary Dashboard
Provides an operational summary of each plant’s status, Size in kW, Energy produced, key events and location.
Inverter Summary
Performance snapshot of the inverters in a plant
Asset run hours
Availability of hours of all the assets at site
System explorer view
Plot all the data channels which is available from the devices
User Management
Allows assignment of specific sites/users to a group profile
Production Totals
Portfolio-level view of the power and energy information displayed on a daily, weekly, monthly and yearly granularity
Inverters, SMBs and SMU's, Transformers, feeders, AC side control panel, Breakers, Energy meter, Weather sensor, I/O's and other equipment
Communication status and device status
Status Overview -Inverter and power control function
Inverters, energy meters which are connected via TCP/IP can be visualized with the communication period intervals even possibility of 1s when power control is required
PR
Customized PR (temperature corrected or specific formula provided)
Automatic Report Generation-fleet wise
Inverter-wise generation, Block level generation and plant level generation reports provided
Actual vs Expected Generation
Based upon current irradiance and Insolation Power Vs Irradiance and Energy Vs Insolation on 5 Min level provided
Specific yield comparison
Comparison of Inverters and site generation with respect to irradiance data
CUF/PLF
Capacity Utilization and Plant load factors are defined as per customer metrics
Availability (Grid and Inverter)
Inverter Availability of solar hours and Grid Availability
PR Box at Master control room
Connect all energy meters at site to evaluate the performance of the sites to have a birds eye view of the project via Smart server
Data transfer protocol (Additional Cost)
Can integrate with Different data transfer protocol, 3rd Party HW setup-Cloud to cloud or device to cloud Configuration data transfer through (API/HTTPS/MQTT/OPC UA/FTP) with Monitoring via data manager
Inverter room Box
Decentralized approach of connecting the critical devices to have a insight of what is going on with the site with inverter level analysis
Reports
Standard and custom reporting capabilities (Daily ,Weekly, Monthly and yearly reporting)-Estimated energy Vs Actual energy with inverter wise generation, specific yield and block wise generation, Block wise generation
Slot wise generation/Hour wise Generation
Energy slot wise generation as per grid company/Hour wise generation
Standard Reports
Pre-configured reports tracking System Energy Output, System Performance, System Power Output in daily, hourly
Custom Reports
Can access any channel with job scheduling and auto reporting functionalities
Assets
Performance management of each plant asset and its components with Visualization and explore the relative power and energy production of all your productive devices.
Alert Explorer
Enables end-user to view assets by location, status (severity of active events) and system size
Diagnostic Charts
Historian of plotting all fault codes from the system view from the specific time period asset wise
CSV Export
Enables user to export the chart as a CSV file for use on all the graphs
Weather
Integration of weather stations with Block wise and inverter wise with comparison of two sensors with the deviation metrics
Traffic Signal view
Status-Production, Breakdowns, Communication, Data quality
Asset Visualization
SLD architecture of site level hierarchy (Inverters, Meter, SMU's ,IO's, Transformers, Feeders ) Customizable with Device frames (Inverters, Meters with Weather stations)-Block wise
Interactive one-line diagram
Control in real-time the status and performance of your facilities’ middle tension components with hyper link to the landing page.
Alarm Management with Alert engine filter (Coming Up**)
All the incidences of your facility in a single tool, with powerful filtering options Define, monitor, detect and manage events, segregating inverter breakdowns, Communication issues, Grid issues, Performance issues, Plant equipment status issues Priority 1,2,3,4, Fire alarms, Critical alarms and communication alarms basically a traffic light display based on priority and customizable as per needs
Alarm Annunciator
Alarm failure with Annunciator and status
Profile Event Log
View events by profile type, plant, event severity and status.
Compare everything (Explorer View)
Compare any combination of monitored and/or modeled variables from any of your facilities.
Saved charts
Make own screens and Set own metrics to data validation
Explorer
Graphical representation of the events
Smart Server
NUC with board supporting package with 1 min interval locally and 5 min on cloud
Plant level and Cloud level
Secured VPN reverse tunneling with encrypted and two level authentication with shore wall
Automatic Report Generation-fleet wise
Inverter-wise generation, Block level generation and plant level generation reports provided
Mobile VPN, FTP, Docker, Wire shark, Devops, Application crash, server availability, memory optimization, Node red, auto file backup and various trouble shooting tools required
Observability platform for SCADA Self diagnosis and curation
Technical Support
Technical support team is available by phone, M-S 8am-7pm
Proactive Plant Issue Reports
Notification of site specific malfunctions which impact 10% or more of the total site's production
Configuration Check
Portal configuration check as per 'as built' documents
Training
Two training workshops per year for Sub-EPC’s, O&M and/or installation team. Training topics include direct demos, case studies, site analysis reports, and troubleshooting cabling issues per industry standard.
Issue Management & Resolution
Renewable operation center team works with the field technician remotely to investigate production issues, determine root cause (device failure, cabling issue, communication issue, etc.) and assist in resolving the issue.
Performance Benchmarking
Sitewide and Inverter wise benchmarking
Document Management
Library access for field tech to access the inverter manual, site layouts and other relevant documents provided by the EPC
Estimated Energy Loss Summary
Site wide estimated loss calculation.
Data logger programming and customization
In house
Inverter Failure Analysis
- Identify inverter failures
- Identify possible causes
- Identify possible resolution
- Identify energy and revenue loss (a minimum of 2 inverters are required for this function)
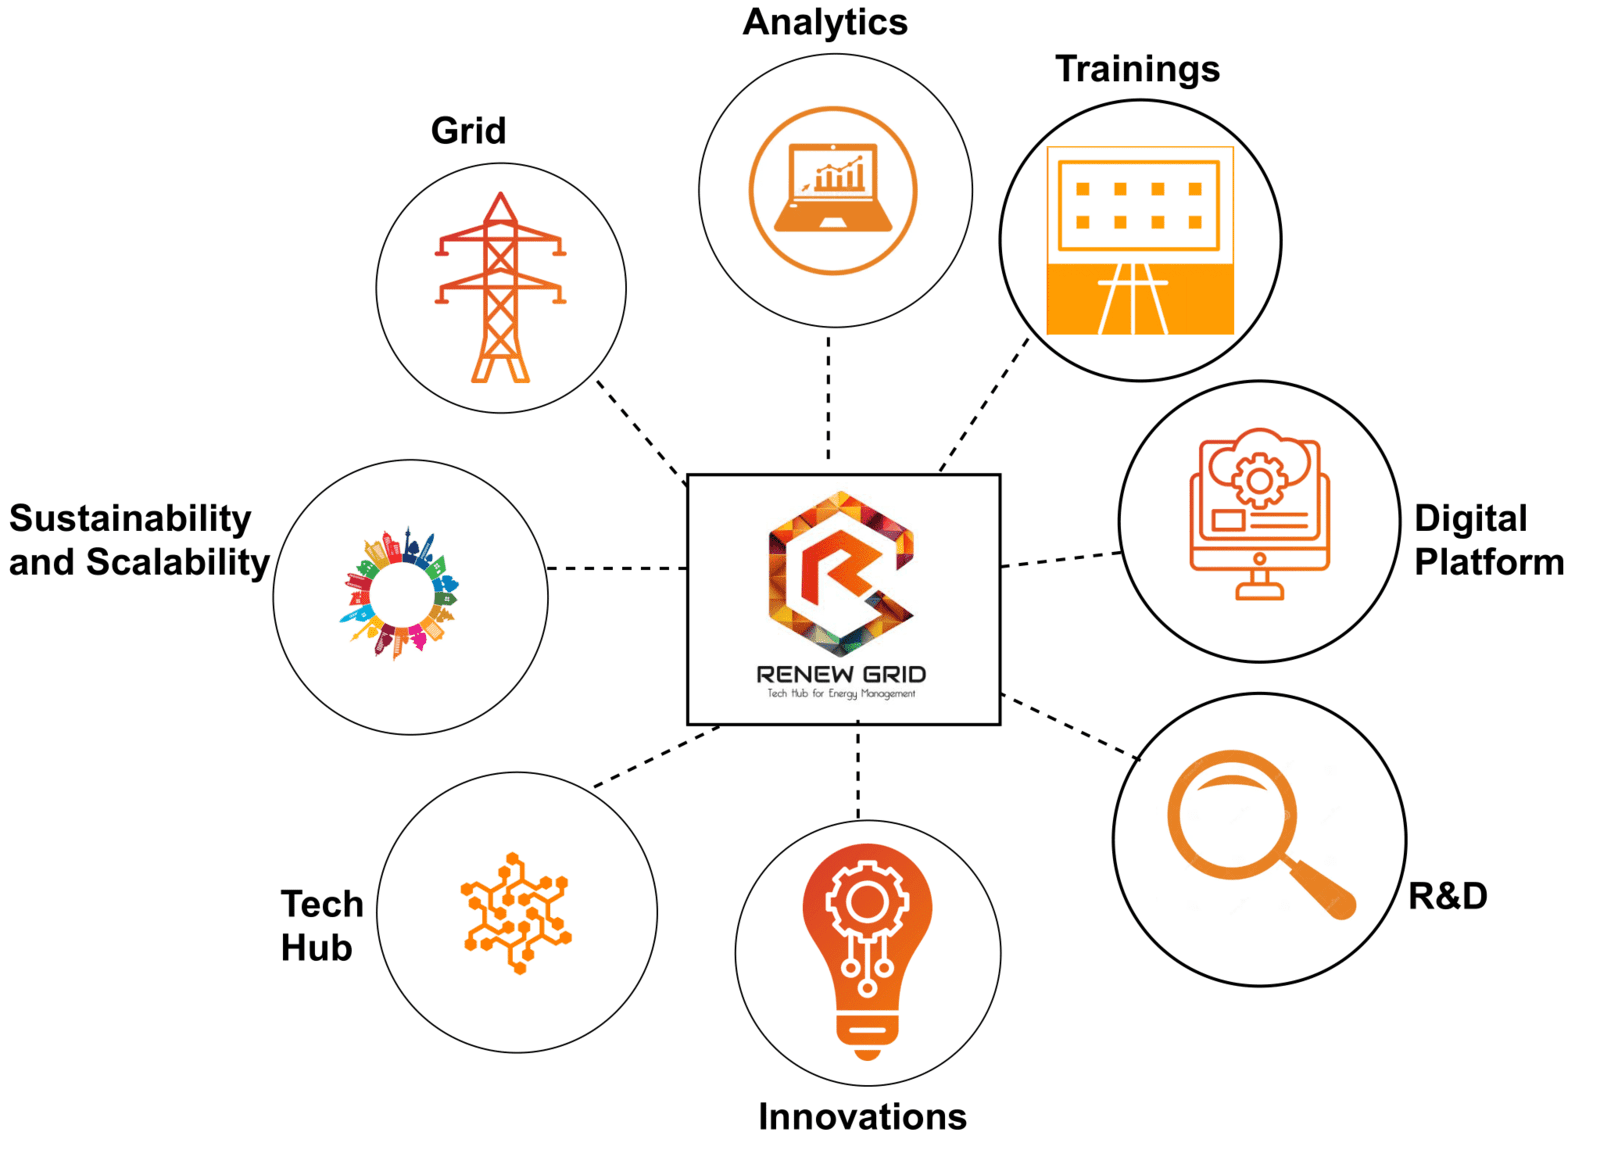
Renew Grid Key Focus Areas

Renew Grid KPI's
The performance which counts!

Maximize your Solar PV Asset Performance with Renew Grid Services
Renew Grid is a pioneering technology hub integrating cutting-edge technologies into energy clusters, delivering a diverse range of innovative products, and empowering optimized energy management through comprehensive solutions and a decentralized, highly skilled team.

- All in One Platform for both Monitoring and Power Control systems - Rooftops, C&I and Ground Mount Systems
- Compatible with all leading Inverter OEMs, Energy Meter OEMs & Flexibility to integrate project-specific new OEM drivers quickly.
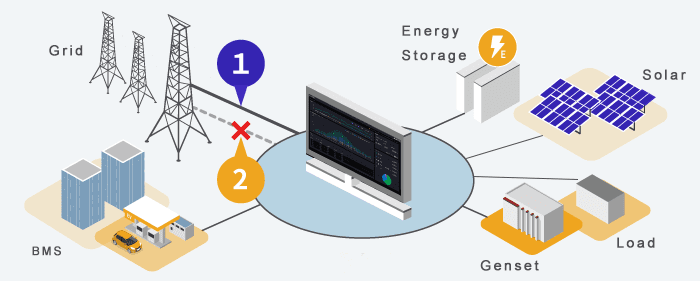
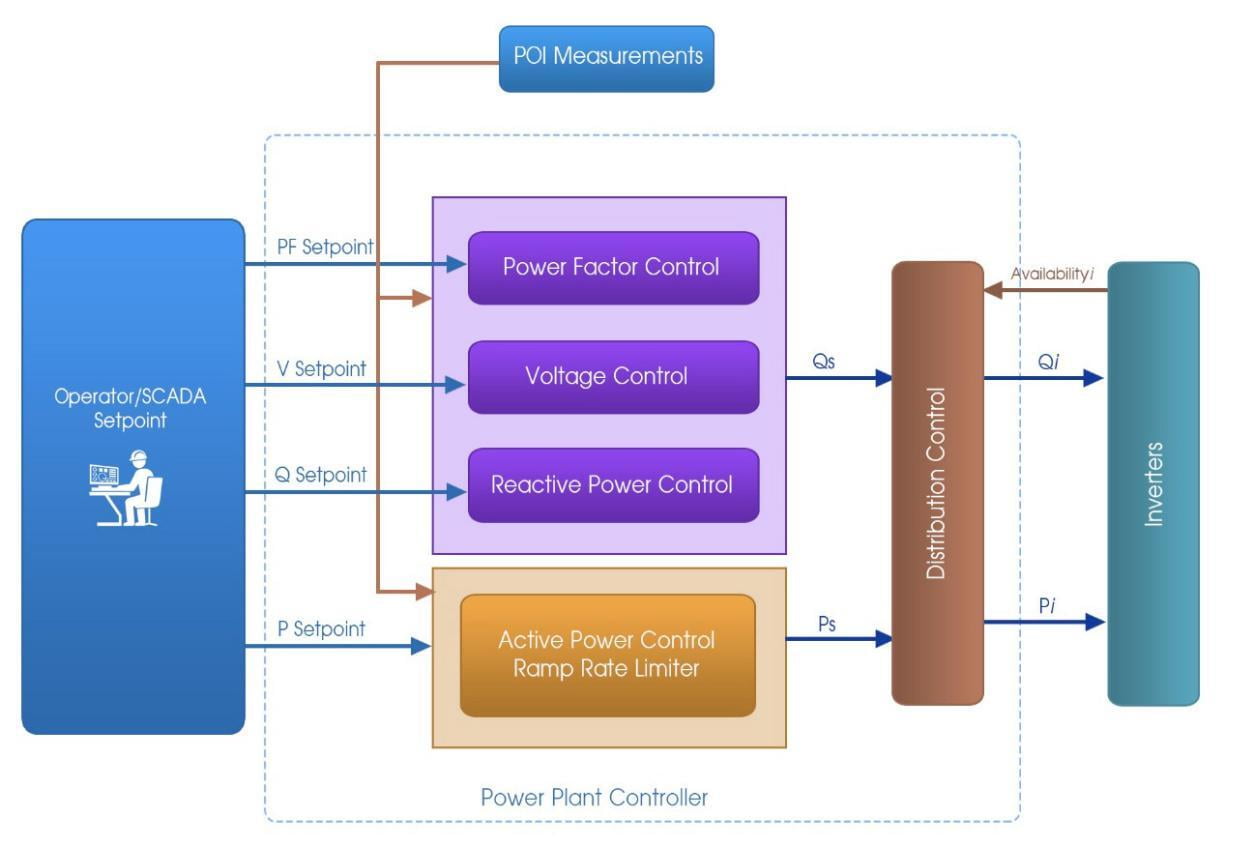
- One Stop controller approach for Active And Reactive power control (Solar- DG synchronization, Zero Export, Power Factor control, Cloud SCADA & Local SCADA)
- Onsite Installation support and Remote technical support
- Energy Utilization with Generation, Consumption and Solar Contribution
- KPIs (Key Performance Indicators)- Deemed Generation, Performance Ratio, CUF, Dashboard-Running Hours, Source Capitalization, Performance benchmarking & ROI
- Alarm management, Customizable dashboards & Reports
- AC side Monitoring with DI/DO visualizations
- Explorer view and data channel plotting of all parameters available in the assets
Facility Management Solution Overview


